The research-peptide grey market is usually described in adjectives — booming, risky, unregulated. This report describes it in numbers: 12,629 independent lab tests, 563 shops, 118 compounds, and daily price reads across every lab-tested listing we track, with purity figures drawn from the Peptigrity Purity Index (all platform figures verified August 2026).
This is Peptigrity's annual state-of-the-market report on grey-market peptides — the research-use-only channel where unapproved compounds are sold outside pharmacy and prescription systems, with no pre-market quality gate. It is the companion to our quarterly peptide purity report, which examines what testing can and cannot tell you; this edition delivers the corpus-wide precision that report deferred, and adds the layers no quality report covers — market size, demand, prices, failures, and enforcement. Every chart below links its compounds to their guide pages, every figure carries its source and date, and the underlying data is published under an open licence so you can check the arithmetic.
How big is the peptide grey market in 2026?
The research-peptide grey market crossed a $100 million annual run rate in 2026 by the most conservative measure available — cryptocurrency inflows alone, which blockchain-analytics firm Chainalysis tracked at $32 million in the first quarter of 2026, up 159% from $12 million the quarter before. Card and bank payments sit on top of that, invisible on-chain. Peptigrity currently tracks 563 shops selling 118 peptides into this market (verified August 2026) — the widest independent product-side view published anywhere.
The growth curve is steep by any denominator. In Chainalysis's on-chain series, published in its June 4, 2026 analysis Inside the $100M Gray Market Peptide Crypto Boom, inflows to identified peptide vendors sat near $1 million per quarter through most of 2024, then rose for six consecutive quarters to the Q1 2026 figure, with second-quarter pacing near $39 million. Demand visibility grew even faster than payment volume: a June 15, 2026 JAMA Viewpoint by Piatkowski, Ganson, and Nagata, Illicit Injectable Peptides and Regulatory Gaps, counted more than 130,000 Instagram posts and over 230 million TikTok views on peptide-related content as of May 2026, and argued that regulatory frameworks were not built for compounds moving simultaneously through approved, compounded, and illicit channels. Eli Lilly, for its part, says its investigators found more than 14,000 websites, advertisements, social posts, and product listings offering its unapproved compound retatrutide across 100-plus countries. No single number captures a market that spans crypto wallets, card processors, and Telegram channels — which is why the table below reports each measurement with its own source rather than pretending they add up to one figure.
Dimension | Figure | Source and date |
|---|---|---|
Crypto inflows to peptide vendors, Q1 2026 | $32 million (159% QoQ; $100M+ annual pace) | Chainalysis, Jun 4, 2026 |
Retatrutide listings identified worldwide | 14,000+ across 100+ countries | Eli Lilly, Aug 12, 2026 |
Peptide content on social platforms | 130,000+ Instagram posts; 230M+ TikTok views | JAMA Viewpoint, Jun 15, 2026 (as of May 2026) |
Shops tracked by Peptigrity | 563 | Peptigrity, verified Aug 26, 2026 |
Peptides tracked by Peptigrity | 118 | Peptigrity, verified Aug 26, 2026 |
Independent lab tests on file | 12,629 | Peptigrity, verified Aug 26, 2026 |
Chart 1 — The market at a glance. External figures are reported measurements by the named organisations; Peptigrity figures are live platform counts.
What does the grey market actually sell? The demand leaderboard
The grey market's demand concentrates hard at the top: retatrutide alone has accumulated 1,245 independent lab tests on Peptigrity — more than any other compound — followed by tirzepatide at 971, BPC-157 at 850, GHK-Cu at 779, and MOTS-c at 542 (verified August 2026). Testing volume is a proxy for buyer attention rather than sales receipts, but it is the most honest demand signal an independent platform can publish.
Rank | Compound | Independent tests on file | What it is |
|---|---|---|---|
1 | 1,245 | Investigational GLP-1/GIP/glucagon triple agonist (Phase 3) | |
2 | 971 | Dual GIP/GLP-1 agonist, approved as Mounjaro/Zepbound | |
3 | 850 | Synthetic gastric pentadecapeptide, preclinical healing research | |
4 | 779 | Copper-binding tripeptide, skin and repair research | |
5 | 542 | Mitochondrial-derived peptide, preclinical metabolic research |
Chart 2 — Most-tested peptides on Peptigrity. Source: homepage most-tested widget, verified August 26, 2026.
The leaderboard's shape tells the market's story. Its top two rows are weight-loss compounds, and the wider weight-loss and metabolic category supplies most of the testing growth of the past year — a direct echo of GLP-1 demand spilling out of the prescription channel. Retatrutide, an investigational triple-receptor agonist that no regulator anywhere has approved as of August 2026, out-tests every approved and unapproved rival — buyers are scrutinising hardest exactly where the legal supply is zero. Independent industry monitoring points the same direction from the seller side: a December 2025 LegitScript market analysis named melanotan, BPC-157, TB-500, PT-141, and GLP-1 products as the compounds most frequently observed in problematic listings across social media and e-commerce, noting that unauthorised sellers increasingly present professional storefronts claiming lab-tested product.
How pure is what's being sold? The Purity Index picture
Tested grey-market peptides are, on average, strikingly pure: the Peptigrity Purity Index — a recency-weighted composite of third-party HPLC results — stands at 99.51 across the 11,029 tests in the index, spanning 63 compounds and 26 laboratories (snapshot dated August 25, 2026). That average has barely moved while the dataset grew two-hundred-fold, holding between 99.43 and 99.66 in every complete quarter since late 2023. The caveat is structural: these are samples someone chose to test, not a random draw from the market.
The volume curve is the finding most people miss. At the end of 2023 the index rested on 52 tests across 6 compounds; it now rests on 11,029 across 63 — and through that entire expansion the composite stayed inside a quarter-point band. Whatever else is true of this market, the material that reaches an independent laboratory keeps clearing the purity bar defined in our peptide purity standards analysis: 95% is research grade, 98% is a strong result.
Quarter | Tests in index | Compounds | Composite |
|---|---|---|---|
2023 Q4 | 52 | 6 | 99.66 |
2024 Q4 | 453 | 27 | 99.46 |
2025 Q2 | 1,187 | 37 | 99.48 |
2025 Q4 | 4,275 | 51 | 99.45 |
2026 Q1 | 7,797 | 60 | 99.50 |
2026 Q2 | 10,522 | 62 | 99.50 |
2026 Q3* | 11,029 | 63 | 99.51 |
Chart 3 — Independent testing volume and composite purity by quarter. *2026 Q3 in progress. Source: Purity Index quarterly table, snapshot August 25, 2026; the full 2023–2026 series, including withheld thin quarters, is published on the index page.
Compound-level spread is narrow at the top and modest even at the bottom. The gap between the highest and lowest indexed compound is about three points — and the lowest still clears the 95% research bar.
Compound | Index | Tests | Labs |
|---|---|---|---|
99.76 | 17 | 8 | |
99.70 | 254 | 21 | |
99.69 | 134 | 16 | |
99.68 | 433 | 21 | |
99.66 | 341 | 21 | |
98.71 | 45 | 13 | |
98.56 | 133 | 17 | |
97.19 | 9 | 6 | |
96.72 | 27 | 11 |
Chart 4 — Top five and bottom four of the Purity Index by compound. Source: Purity Index, snapshot August 25, 2026; compounds below 5 tests render an em dash on the index, never an estimate.
Two details deserve note. First, heavy scrutiny has not dented the leaders: tirzepatide (99.74 across 977 indexed tests) and retatrutide (99.68 across 1,258) sit in the top tier despite carrying the largest test volumes — retatrutide is the index's single biggest contributor at 11.41% of composite weight, right at the edge of the 15% cap that stops any compound dominating the headline number. Second, movement is small and mostly upward: the biggest 90-day gainer is Thymalin at +0.93, and the only notable decliner is AHK-Cu at −2.50, on a 27-test base where a few weak certificates move the needle.
What actually fails — and it isn't purity
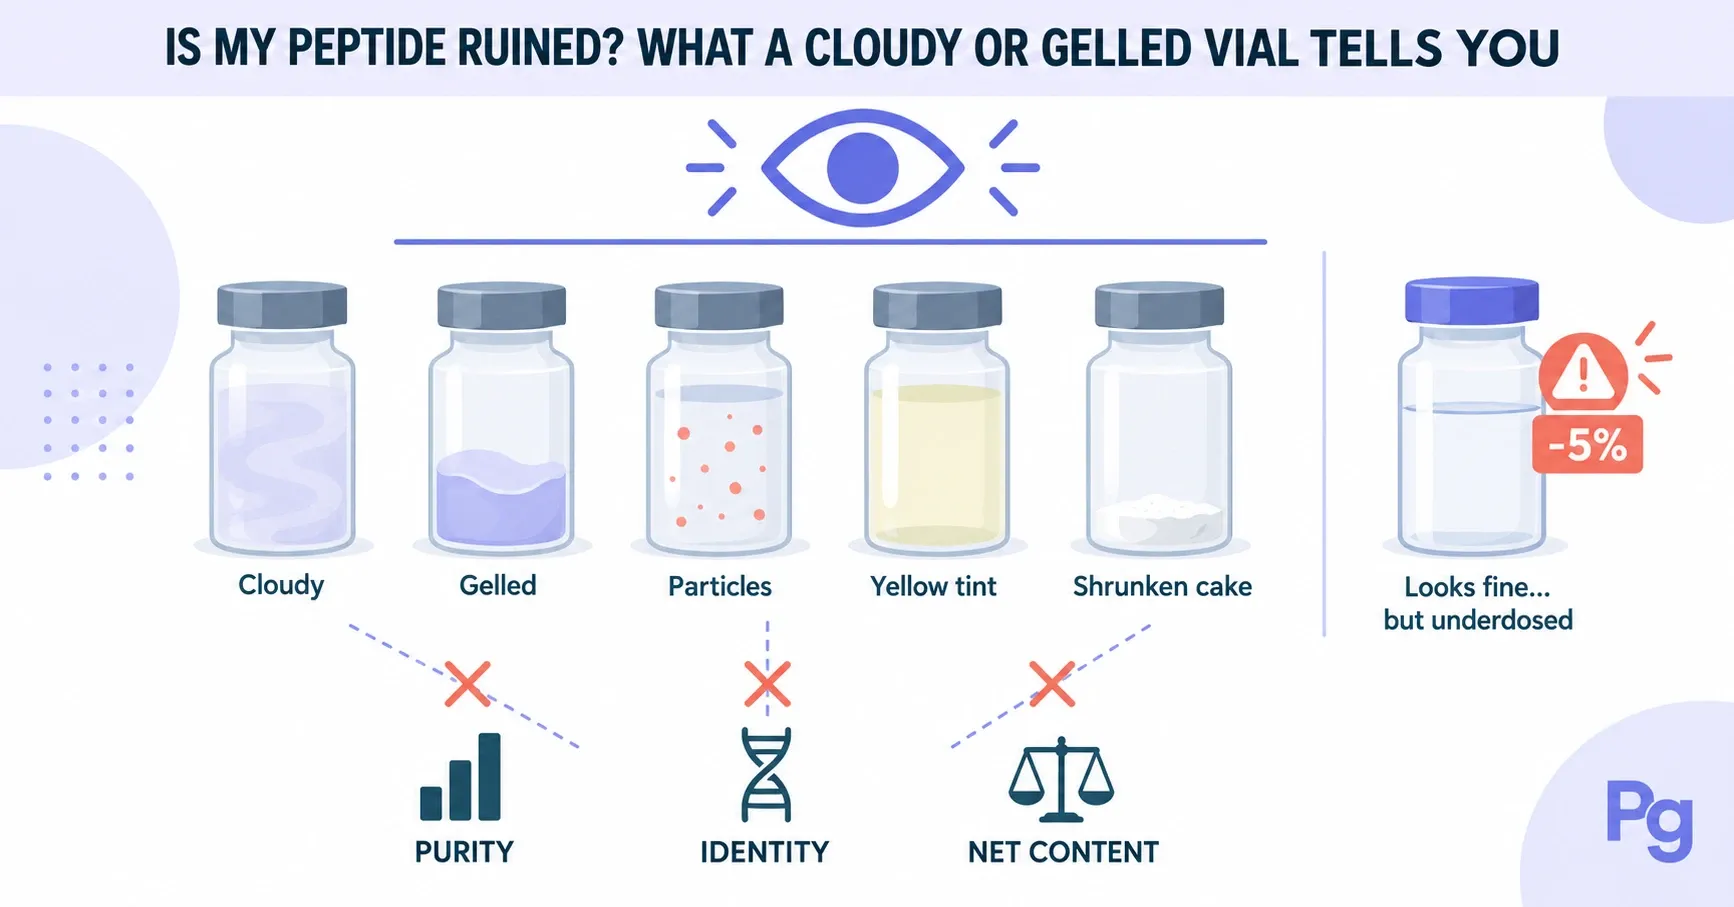
The failure mode that actually bites buyers is quantity, not purity. Across all 12,691 published purity tests, just 0.28% fall below the 95% research-grade bar — 35 tests. But across the 12,118 tests carrying a measured net-content figure, 7.16% came in underdosed below 95% of the labelled amount — 868 vials, roughly 26 times more common than a purity failure (Purity Index, verified August 2026). A vial can be 99% pure and still short you.
The mechanism is arithmetic, not fraud-by-default. HPLC purity reports what fraction of the material present is the target peptide; net content reports how much material is actually there once the counterion salt and residual water are subtracted from the gross fill — the full accounting is in why a 10 mg vial isn't 10 mg. A vendor can buy genuinely pure material and still under-fill, over-dilute, or lose mass to sloppy lyophilisation, which is why the two rates diverge so sharply and why quantity is the metric that separates vendors while purity barely does.
Failure mode | Rate | Denominator | What it means for the buyer |
|---|---|---|---|
Purity below 95% | 0.28% (35 tests) | 12,691 published purity tests | Rare — purity is not where the market fails |
Net content below 95% of label | 7.16% (868 tests) | 12,118 net-content tests | The dominant failure — verify milligrams, not just a percentage |
Wrong compound (identity) | Not reported | Mass-spec results not structured data | Deliberately unpublished rather than estimated |
Sterility / endotoxin | Outside this dataset | — | Separate assays — see the testing guide |
Chart 5 — The failure anatomy. Source: Purity Index fail-rate blocks, snapshot August 25, 2026. Failure rates are drawn from wider populations than the composite itself, which is why their denominators exceed the in-index test count.
Two honest gaps bound this table. Identity failure — the vial contains a different molecule than the label claims — is the most serious failure mode and the one we do not quantify, because mass-spectrometry confirmations are not yet captured as structured data; publishing a made-up rate would be worse than publishing none. And sterility or endotoxin problems never appear in a purity number at all; how to test peptides covers the separate assays that address them.
What does it cost? Price dispersion across lab-tested shops
Across roughly 71 compounds with enough live offers to publish, the grey market prices the same molecule wildly differently: Peptigrity's daily storefront reads across lab-tested shops put median prices at $5.50 per milligram for retatrutide, $5.06 for tirzepatide, and $7.77 for semaglutide (verified August 26, 2026) — while the lowest tracked retatrutide listing sits near $0.13/mg, roughly 43-fold below its median. Figures exclude shipping, taxes, coupon codes, bulk tiers, multi-vial kits, and account-gated pricing, so the lowest tracked price is not the lowest payable.
The dispersion, not the median, is the market signal. Live per-milligram price comparison data is read automatically from public storefronts of shops that have third-party lab tests on file — no affiliate links, no paid placement, no manual entry — and on almost every compound the cheapest listing sits far enough below the median to deserve scrutiny rather than celebration. An offer priced at a fraction of every competitor is, statistically, an outlier first and a bargain second: sometimes a promotional loss-leader on a small vial, sometimes a listing whose economics only work if the vial is short. Vial-size economics also compress per-milligram prices as fill size rises, since the vial, freeze-drying, labelling, and testing cost about the same at 5 mg as at 50 mg — compare within your size band, and run the cost calculator on net milligrams rather than sticker price.
Compound | Lowest $/mg | Median $/mg | Shops in stock |
|---|---|---|---|
Retatrutide | $0.128 | $5.50 | 13 |
Tirzepatide | $1.17 | $5.06 | 14 |
Semaglutide | $2.50 | $7.77 | 10 |
BPC-157 | $1.43 | $4.90 | 69 |
IGF-1 LR3 | $30.00 | $75.00 | 39 |
$0.20 | $3.50 | 37 |
Chart 6 — Price dispersion across lab-tested shops, selected compounds. Source: Peptigrity price reads, August 26, 2026; exclusions as stated above.
Two rows illustrate the range of the market's economics. IGF-1 LR3 is the most expensive mainstream compound per milligram — a $75 median that reflects a genuinely harder synthesis — while SNAP-8's 17-fold lowest-to-median gap shows how a cosmetic peptide's price collapses at the bottom of the market. The GLP-1 cluster clusters tightly around $5–8/mg at the median, which is precisely the pricing gap versus branded pharmacy product that pulls buyers into this channel in the first place.
Who supplies it, who's cracking down, and the testing paradox
Supply runs through Chinese synthesis, crypto payment rails, and research-use-only labels — and 2026 is the year enforcement caught up. Eli Lilly filed six lawsuits on August 12, 2026 against alleged sellers of unapproved retatrutide and says it has referred more than 200 entities to regulators, after the FDA declared such sales illegal in June. U.S. Customs and Border Protection seized more illicit GLP-1 product in July 2026 alone — roughly 90,000 vials, per figures the agency gave Reuters — than in all of fiscal 2025.
On the supply side, most research-peptide active ingredient is synthesised in China and finished elsewhere, a chain we map in where research peptides are manufactured. Chainalysis's on-chain work adds a darker allegation: it identified Chinese chemical suppliers — naming Shanghai Sigma Audley New Material Technology and Bigreat Technology as case studies — that it says previously supplied fentanyl and amphetamine precursors before allegedly rebranding to sell peptides to retail buyers, in some cases using the same contact details and wallets. The same report documents the payment plumbing: stablecoins overtook Bitcoin among vendors averaging deposits above $1,000, and, in the firm's words, "To scale, the gray-market peptide trade adopted cryptocurrency as its backbone."
The enforcement wave is now multi-front. The FDA's June 15, 2026 statement, FDA's Concerns with Unapproved GLP-1 Drugs Used for Weight Loss, warned that unapproved semaglutide, tirzepatide, and retatrutide products labelled for research are being sold for human use and cannot lawfully be compounded. Lilly's August 12 press release announced the six suits — against a med spa chain, a compounding pharmacy, and online sellers whose products it alleges are intended for human use despite research-only labels — and publicly called on social-media platforms, payment processors, card networks, and shipping carriers to cut sellers off; the defendants' filings and any responses will test those allegations in court. CNBC's coverage added the customs arithmetic: over 690 intercepted shipments totalling 31,000-plus units of illicit GLP-1 drugs in fiscal 2025, then more than 1,400 seizures in July 2026 alone. Sellers respond to pressure the way this market always has — by churning identities and migrating channels, patterns we document in why peptide vendors keep shutting down and in the risk profile of Telegram and Discord peptide vendors. All regulatory and legal statements here are current as of August 2026 and will move.
Then there is the finding that looks like a contradiction and isn't. Chainalysis estimates that spending on independent testing fell roughly 88% per buyer, to about $8, even as volume at the Czech laboratory Janoshik rose — while Peptigrity's series shows absolute test volume growing two-hundred-fold since late 2023 across the 26 laboratories in our testing-labs directory. Both are true, because the denominators differ: testing grew absolutely and collapsed relatively, as new buyers flooded in far faster than testing culture spread. A market of early adopters who tested everything became a mass market where most participants test nothing — which is exactly why the untested majority, not the tested average, is where the risk now lives.
Where this data comes from — and how to cite it
Every figure in this report comes from data Peptigrity publishes openly: 12,629 independent lab tests on file across 563 shops and 118 peptides (homepage count, verified August 26, 2026), with purity and failure rates drawn from the Purity Index — a recency-weighted composite that publishes a compound only at five or more tests, caps any single compound at 15% of total weight, and renders an em dash rather than an estimate below threshold.
The mechanics matter, so here they are. Tests within 90 days count at full weight, within a year at 0.6, and older at 0.3; blend vials and net-content-only certificates are excluded from compound averages; the page regenerates hourly and a nightly snapshot locks each day's figure so any dated citation stays reproducible. Three different totals appear across the platform because they answer different questions: 11,029 tests sit behind the composite (compounds clearing the five-test threshold), 12,691 is every published test carrying a purity value (the denominator for the fail rate), and 12,629 is the homepage's live count of all lab tests on file — recomputed on its own schedule, which is why it can briefly trail or lead the index totals. This report uses the homepage figure as its headline and the index for every purity and failure claim. Selection bias applies throughout: these are submitted tests, not a randomised market survey, and they say nothing about safety or efficacy — different questions, answered by clinical evidence most of these compounds do not have. The dataset is also entirely separate from Peptigrity's trust scores, which weight independent lab purity and verified community reviews equally (50/50 as of August 2026) under a published method — see how we calculate trust scores — and from the platform-conduct rules in our methodology. Peptigrity sells nothing and takes no advertising, sponsorship, or affiliate revenue from any shop listed.
The data is yours to reuse. The index is published under the Creative Commons Attribution 4.0 licence with open JSON and CSV files, and it supplies its own citation format:
The Peptigrity Purity Index, Peptigrity, 2026-08-25. Composite 99.51 across 11,029 third-party HPLC tests in the index. https://peptigrity.com/purity-index
What should a buyer actually do with this?
Three checks follow directly from the data: verify net content, not just a purity percentage, because underdosing is roughly 26 times more common than a purity failure; treat a price far below a compound's median as a reason to investigate rather than a deal; and weight sources by multiple recent independent tests, since the real risk concentrates in the majority of vials nobody tests.
None of this is a recommendation to buy — this report measures a market, it does not endorse one, and nothing in a purity or quantity number speaks to whether an unapproved compound is safe or appropriate for any person; that is a conversation for a licensed healthcare provider. But measurement changes behaviour on both sides of the counter: shops that know random vials get tested fill them more honestly, and buyers who know underdosing is the dominant failure ask for net-content data instead of being reassured by a 99% badge. The full pre-purchase workflow — certificate verification, identity confirmation, net-content math, multi-test history — is laid out step by step in how to verify peptide quality before you buy, and the quarterly purity report linked at the top of this page goes deeper on what each assay can and cannot tell you. Next year's edition will run the same measurements against this baseline; the most useful number in this report may turn out to be the date on it.
Frequently Asked Questions
How big is the peptide grey market in 2026?
At least a $100 million annual run rate, and that is only the cryptocurrency slice: Chainalysis tracked $32 million in crypto inflows to peptide vendors in Q1 2026 alone, with card and bank payments invisible to on-chain analysis sitting on top. On the product side, Peptigrity tracks 563 shops selling 118 compounds (verified August 2026) — the market's breadth, independent of how it gets paid.
Are grey-market peptides actually pure?
The tested ones, on average, yes: the Purity Index composite stands at 99.51 across 11,029 third-party HPLC tests (snapshot August 25, 2026), and even the lowest indexed compound clears the 95% research bar. The trap is the qualifier — these are samples someone chose to test. Purity also says nothing about safety, efficacy, sterility, or whether the vial contains the labelled dose.
What is the most common way a vial fails?
Underdosing. 7.16% of tests with a measured net-content figure came in below 95% of the labelled amount, versus 0.28% of purity tests falling below the 95% bar — roughly a 26-fold difference (verified August 2026). Check the milligrams, not just the percentage: a 99%-pure vial can still be substantially short of its label.
Are grey-market peptides legal to buy?
It depends on the compound and the country, and "research use only" labels confer no approval anywhere. In the United States, the FDA stated in June 2026 that selling unapproved GLP-1 drugs such as semaglutide, tirzepatide, and retatrutide to consumers is illegal, and most other compounds occupy jurisdiction-specific grey zones as of August 2026 — the country-by-country picture is in our regulatory status guide.
Why is the cheapest listing a red flag?
Because it is usually an outlier, not a market price. Retatrutide's lowest tracked listing sits roughly 43-fold below its median; gaps like that are occasionally promotions and more often listings whose economics depend on a short fill — and the tracked lowest already excludes shipping, coupons, and gated pricing, so the real-world gap is smaller than it looks. Scrutinise anything priced far below every competitor before celebrating it.
Can I reuse the numbers in this report?
Yes. The Purity Index and its open JSON/CSV files are published under Creative Commons Attribution 4.0 — reuse them commercially or otherwise with credit to Peptigrity, using the citation format shown in the methodology section above. Platform counts should be cited with their verification date, since they move daily.
This article is for educational and informational purposes only and does not constitute medical advice. Peptides discussed may be investigational compounds not approved by the FDA (or equivalent regulators in your jurisdiction) for human use. Always consult a qualified healthcare provider before using any peptide or research compound. Peptigrity is an independent review platform and does not sell, endorse, or recommend specific products or vendors.